· projects · 8 min read
Sun Tracker
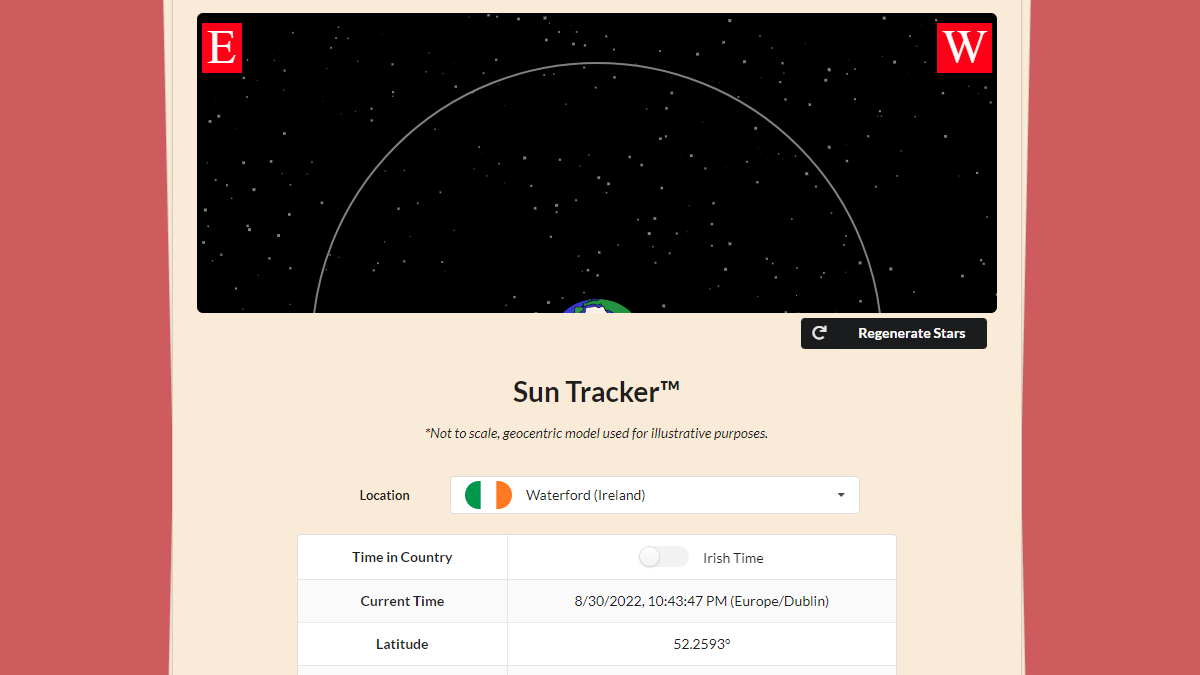
Website that displays the current position of the sun in a variety of countries.
Introduction
I’ve always wanted to work on a serious project involving the Canvas API, which is why I decided on an idea (for my second semester university project) that can benefit from simple shapes and lines being drawn to the screen: a website that shows the current position of the sun in certain countries.
To accomplish this, I had to figure out how to do two things:
-
Get the position of the sun in the sky
-
Put it on the screen somehow.
Tracking the Sun
Where do we even begin?
“This is easy, right? There is probably a global network of observatories and satellites operated by NASA that track the position of the sun in its spare time. Just Google ‘Free NASA Planet Position API’ and you’re good to go.”
Nope, not really a thing as far as I know. Turns out, a bunch of scientists decided we should determine the position of the sun using Math.
Naturally, I Googled “How to find the position of the sun?”, and clicked on the first Wikipedia article. This article provides a solution to the problem in three easy steps:
-
Calculate the Sun’s position in the ecliptic coordinate system,
-
Convert to the equatorial coordinate system, and
-
Convert to the horizontal coordinate system, for the observer’s local time and location. This is the coordinate system normally used to calculate the position of the Sun in terms of solar zenith angle and solar azimuth angle, and the two parameters can be used to depict the Sun path.
Uh, alright, maybe not so easy. Time to pull an all time classic: using an NPM library instead of getting a PhD in Astronomy and implementing all of the maths yourself.
Don’t judge me, how would you feel if you wanted to work on a simple project and this is one of the equations you have to solve:

Using a library
Turns out, there is a library that does exactly what we need: SunCalc.
Specifically, this function (taken from the docs):
SunCalc.getPosition(/*Date*/ timeAndDate, /*Number*/ latitude, /*Number*/ longitude);
which returns:
- Altitude: sun altitude above the horizon in radians, e.g. 0 at the horizon and PI/2 at the zenith (straight over your head)
- Azimuth: sun azimuth in radians (direction along the horizon, measured from south to west), e.g. 0 is south and Math.PI * 3/4 is northwest
No idea what those mean? Here is a diagram:

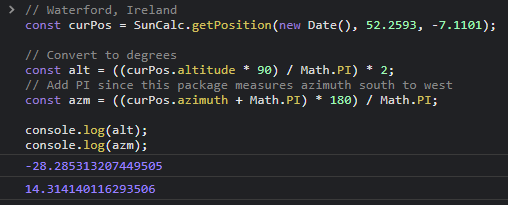
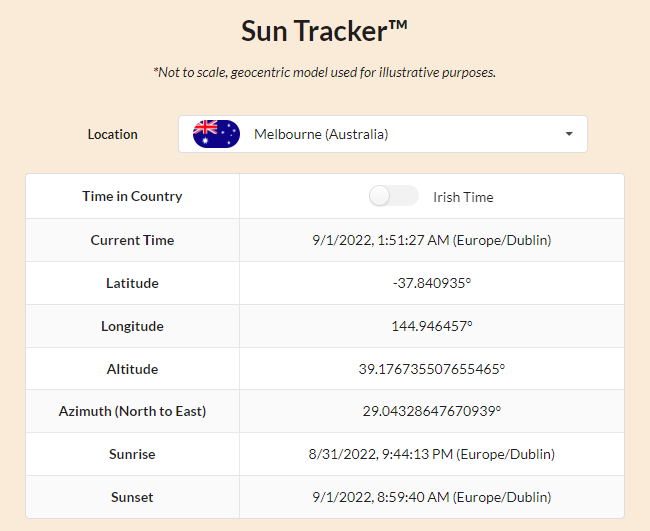
That is exactly what we need! Let’s pass some arguments:
// Waterford, Ireland
const curPos = SunCalc.getPosition(new Date(), 52.2593, -7.1101);

// Convert to degrees
const alt = ((curPos.altitude * 90) / Math.PI) * 2;
// Add PI since this package measures azimuth south to west
const azm = ((curPos.azimuth + Math.PI) * 180) / Math.PI;
Result:
Drawing to the Screen
Now that we have the position, we just need to display it in some nice way.
Three.js would work, but that’s probably overkill. So instead, let’s use the Canvas API.
What do we put on the there?
I decided on four main elements:
-
Black backdrop with stars
-
The Earth
-
Direction indicators
-
The Sun, orbiting the Earth (and the sun’s path in the sky)
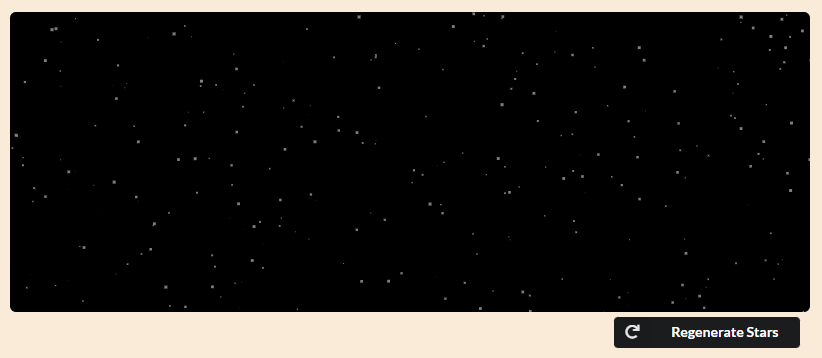
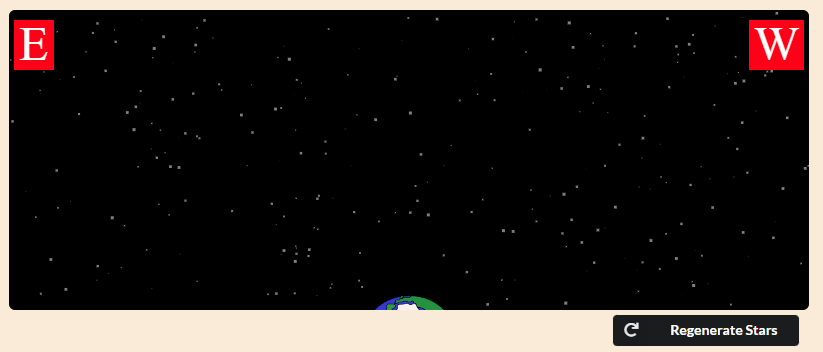
Backdrop
This is fairly easy, just make the background black, right?
We could do that, but it would look a bit bland. Let’s add some stars to liven it up a bit! (and maybe a button to redraw them).
// Setup
const starsNum = 300;
let stars = [];
const width = canvas.width;
const height = canvas.height;
const ctx = canvas.getContext('2d');

// Space Backdrop
ctx.fillStyle = 'black';
ctx.fillRect(0, 0, width, height);

ctx.fillStyle = 'gray';

// Stars
stars = generateStars(starsNum, width, height);

for (const { x, y, size } of stars) {
	ctx.fillRect(x, y, size, size);
}
This is what generateStars looks like:
export function generateStars(num, width, height) {
	const _stars = [];

	for (let i = 0; i < num; i++) {
		_stars.push({
			x: Math.random() * width,
			y: Math.random() * height,
			size: Math.random() * 3
		});
	}

	return _stars;
}
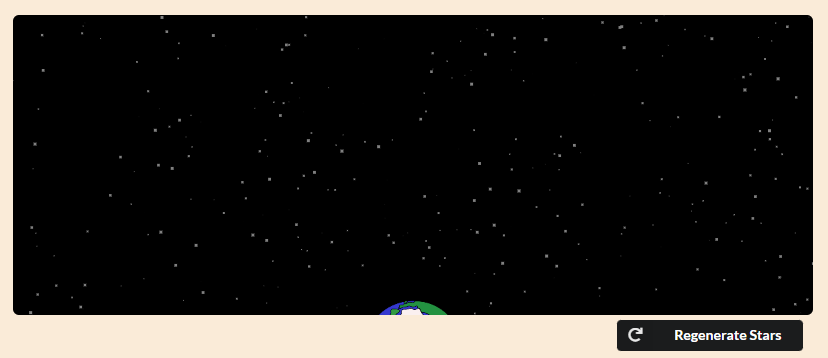
The Earth
We could draw our own Earth, but I’m lazy, so let’s just use a royalty-free, no-attribution image :P.
// Setup
const earth = new Image();
const earthSize = 100;
// Offset the earth so the angle of the sun makes more sense.
const earthHeightMod = 35;

const earthX = width / 2 - earthSize / 2;
const earthY = height - earthSize / 2 + earthHeightMod;

ctx.drawImage(earth, earthX, earthY, earthSize, earthSize);
You didn’t set the ‘src’ for ‘earth’?
Worry not, we have to wait for images to load, but I decided to use promises:
// In another file...
export function promisifyLoad(imgs) {
	if (!Array.isArray(imgs)) return;

	return imgs.map(
		(img) =>
			new Promise((resolve) => {
				img.addEventListener('load', () => {
					resolve();
				});
			})
	);
}

// Setup
earth.src = 'assets/img/earth.png';
sun.src = 'assets/img/sun.png';

Promise.all(promisifyLoad([earth, sun])).then(() => {
	// Updates and redraws everything
	update();
	// Removes loading bar (that we need because this takes a while)
	document.getElementById('loader').style.display = 'none';
});
This is what we have now:
Directions
This actually is fairly easy, we just need two signs:
// Boxes
ctx.fillStyle = 'red';
ctx.strokeStyle = 'white';
ctx.fillRect(5, 10, 40, 50);
ctx.fillRect(width - 60, 10, 55, 50);

// Text
ctx.font = '48px serif';
ctx.fillStyle = 'white';
ctx.strokeStyle = 'black';
ctx.textAlign = 'start';
ctx.fillText('E', 10, 50);
ctx.textAlign = 'end';
ctx.fillText('W', width - 10, 50);
Why these directions? Since the Sun rises in the East and sets in the West, and we want to show its position in 2D, let’s have it on the left side of the Earth while it is rising, and on the right side when it is setting.
Don’t worry if this doesn’t make any sense to you, you’ll see what I mean in the next step.
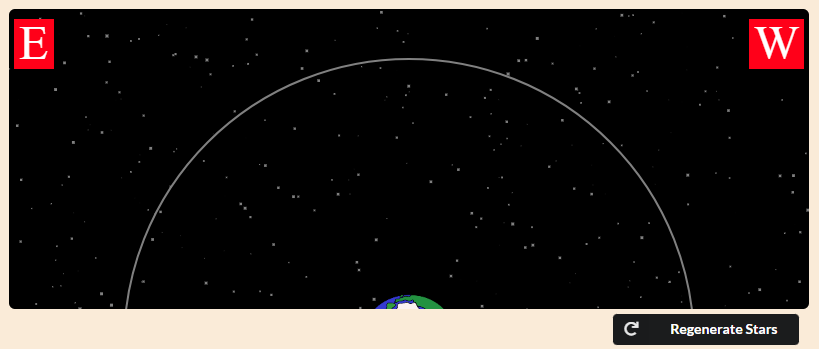
The Sun
Just one thing left, the star of the show (get it?).
Let’s do the easy part first, the path of the sun, which is basically just an arc:
// Setup
const sunSize = 100;

// Path
ctx.beginPath();
ctx.arc(
	width / 2,
	height + earthHeightMod,
	height + earthHeightMod - sunSize / 2,
	0,
	1 * Math.PI,
	true
);
ctx.lineWidth = 2;
ctx.strokeStyle = 'grey';
ctx.stroke();
The numbers don’t really matter so don’t worry if it looks convoluted.
Now we just need the sun to follow that path:
// Setup
const sun = new Image();

// Sun
let angle;
// If azimuth is less than 180 the sun is rising (simplification)
// so draw it on the left side of the arc.
if (azm < 180) {
	angle = Math.PI + curPos.altitude;
} else {
	angle = 2 * Math.PI - curPos.altitude;
}

const cx = width / 2 - sunSize / 2;
const cy = height - sunSize / 2 + earthHeightMod;
const r = height + earthHeightMod - sunSize / 2;

const sunX = cx + r * Math.cos(angle);
const sunY = cy + r * Math.sin(angle);

ctx.drawImage(sun, sunX, sunY, sunSize, sunSize);
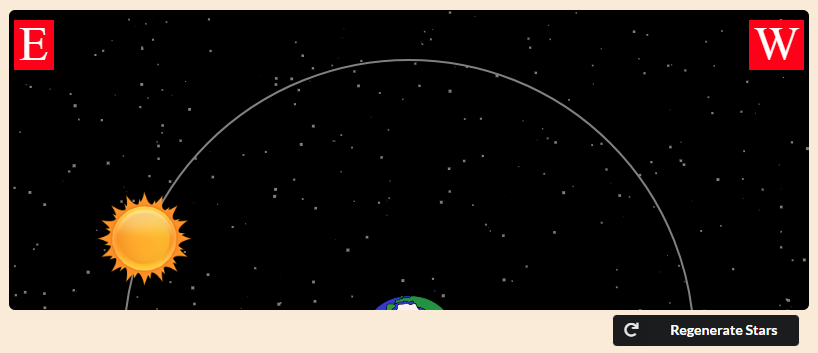
Don’t worry if you don’t get the math, but you can read the next section if you’re interested.
Nerd stuff
Diagram by Location Works,
taken from this article. Copyright © Location Works, 2002.As you can see, the sun’s path is an arc starting in the East and ending in the West. If North is 0° then East is 90°, South is 180°, and West is 270°. This is the Azimuth.
Therefore, if the azimuth is less than 180°, it is between North and South, which means the Sun is rising. Otherwise, it is setting.
Remember, if the sun is rising we want to put it on the left, otherwise, we put it on the right.
Since we are making the sun follow a circular path, we need to use Cos and Sin. But if we pass them 45° (in radians), for example, it will end up top-right, instead of top-left:

Therefore, we need to add Math.Pi (180°) to put it on the left (when it is rising), and subtract it from 2 * Math.Pi (360°) to keep it on the right (when it is setting).
if (azm < 180) {
	angle = Math.PI + curPos.altitude;
} else {
	angle = 2 * Math.PI - curPos.altitude;
}
If we weren’t using the Canvas API we would actually do the opposite e.g. subtract from Math.PI when rising. However, we need to switch the sign on the y value, since the Canvas API actually increases the y coord as you go down.
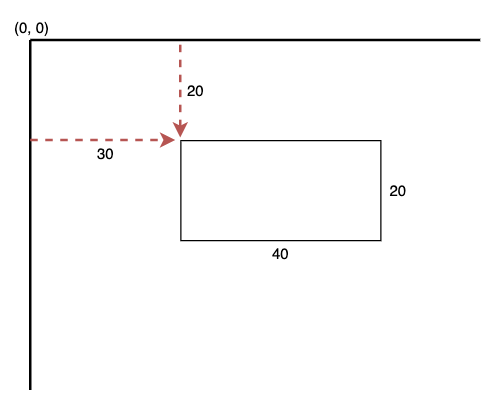
Diagram by Patrick Morrow,
taken from this article. Copyright © Coding.Academy, 2021.Finishing Touches
That’s pretty much it. To finish it off, we can display some data and style the whole thing using Semantic UI.
By using @mapbox/timespace we can find out the approximate timezone at a given set of coordinates and use SunCalc again to get different times of interest e.g. sunrise.
// This function takes long lat instead of lat long for some reason.
adjTime = ts.getFuzzyLocalTimeFromPoint(curTime, coordArr.slice().reverse());

times = SunCalc.getTimes(adjTime, ...coordArr);
See it for yourself
Thanks for reading this far! The site should currently be live here. You can also view the source code on GitHub.